Microsoft Fabric is a cloud-based platform that lets you, among other Data Activity, stream, analyze, and visualize data from different sources, such as sensors, smart meters, or IoT devices.
Since last Microsoft May 2024 events Real-Time Intelligence in Microsoft Fabric is now available with features in general availability and public preview. You can sign up for a free trial and start exploring the benefits of streaming data analytics and action at https://aka.ms/newrealtimeintelligence.
Solar panels are a wonderful way to reduce your carbon footprint and save money on your electricity bills.
💡 Why not analyze and monitor your solar panel production and home energy consumption in real time, and get insights into your energy patterns, trends, and anomalies taking advantage of the SaaS offering to quickly develop the solution.
📢 it has never been easier to create an intelligent real-time solution: Differences between Real-Time Intelligence and comparable Azure solutions

PaaS & SaaS offerings
In this article, I will present how to gather and stream information from your solar panels and smart meters to Microsoft Fabric Eventstream, enrich, filter transform the data and store events to an Eventhouse. Be able to access a dashboard that shows you your solar panel production and home energy consumption in real time and provides you with various charts and reports to help you understand and optimize your energy usage. Let’s get started!
Below is an architecture diagram of the solution:

Real-Time Intelligence Architecture
Below the corresponding Task Flow version with all the different artifacts that we will implement:

Task Flow Tasks
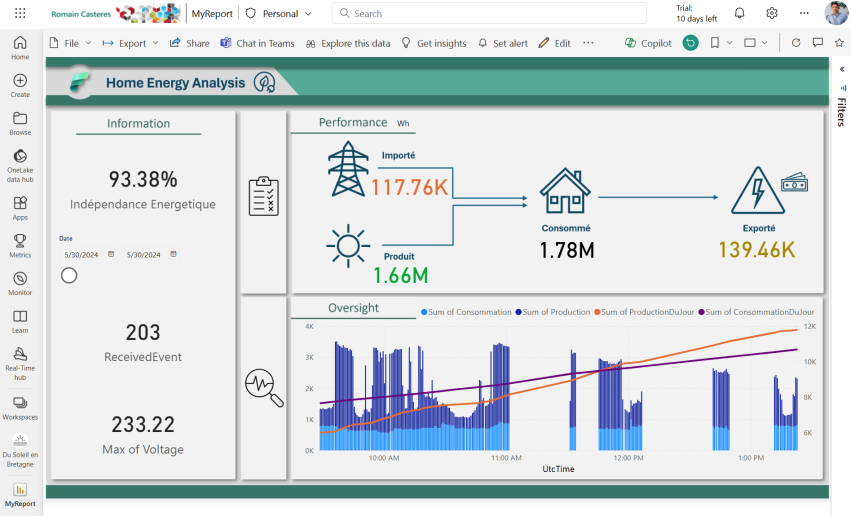
Below one of the analyses, showcasing that, yes, in Britany we have some Sun 😀☀️ (sometime in a day or we say multiple time within a day when there is no rain, we often have 4 seasons in 1 day!):

Power BI Interactive Report
La suite est disponible sur LinkedIn à l’adresse suivante : Analyzing Solar Panel production and home energy consumption in real time with Microsoft Fabric

Comments are closed.